Often, what many bikers covet most at the end of tuning is a nice dyno graph (Figure 1) highlighting the differences between before and after tuning.
- Red Lines : Standard Motorcycles.
- Blue Lines : Partial Stage I with mufflers and tuning only.
- Green Lines : Complete Stage I with air filter, mufflers, and tuning.
The difference is quite marked, both in terms of power and torque, yet merely reading the graph doesn’t truly indicate whether the tuning was carried out to perfection. Let’s try to explain.
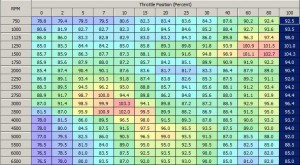
To obtain a dyno graph such as in Figure 1: keep the motorcycle in 4th or 5th gear at about 1600/1800 rpm for a few seconds, and then accelerate, keeping the throttle fully open until you reach the maximum number of revolutions for the engine. To relate, in a partial but explanatory manner, the dyno graph to the map refer to Figure 2 which represents the table of Volumetric Efficiency (VE) of a cylinder. The highlighted column corresponds to a fully open throttle (Throttle Position = 100%).
The highlighted column is therefore the only part of the entire map table measured in a dyno graph.
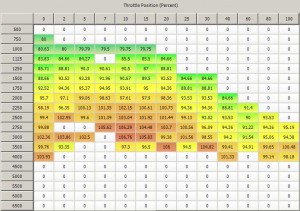
Figure 3 shows the same VE table, but this time the highlighted cells are those affected during the typical use of an engine. We see how these cells are many more than those in Figure 2 from a dyno graph. It is therefore almost obvious to conclude that a typical dyno graph cannot tell if a motorcycle’s engine has been tuned throughout its complete range of use.
Now many of you are wondering how to tell if your bike’s tuning was or will be performed to perfection; no fear, there is an answer.
Science and Empiricism
Tuning a motorcycle is a mix of science and empiricism. It’s like in the medical field – I hope doctors don’t take offense for comparing tuning a motorcycle to curing a patient. Judging the result follows the same method:
- scientific – based on a series of reports generated by test tools,
- empirical – based on the sensations riding the tuned bike.
The “scientific” method
Although incomplete, the dyno graph certainly indicates what to expect from the bike during accelerations with wide throttle openings. Yet since what we want is a primed and responsive bike at all engine speeds and throttle openings, we must integrate the information from the dyno graph with something more comprehensive.
Without weighing this brief article down with too many technical details, we will only focus on the analysis of the cylinders’ VE which is a value needed to correctly deliver the air/fuel mixture.
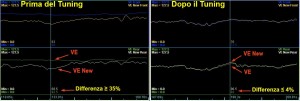
Figure 4 shows the deviations of the VE values present in the map before and after tuning. An engine with an approximate tuning has deviations that exceed ±30%, while an engine with an optimal tuning they are below ±5%. This certifies that the tuning is excellent.
However, sometimes the log file format cannot be read by the analysis software and therefore another method can be used.
The empirical method
The empirical method is based on the sensations from riding the tuned bike. A motorcycle with a well-tuned engine can be felt immediately: the engine turns fluidly, accelerates quickly without gaps or hesitations and driving pleasure hits new highs.
It’s difficult to explain or add anything else, the best thing is to try.


